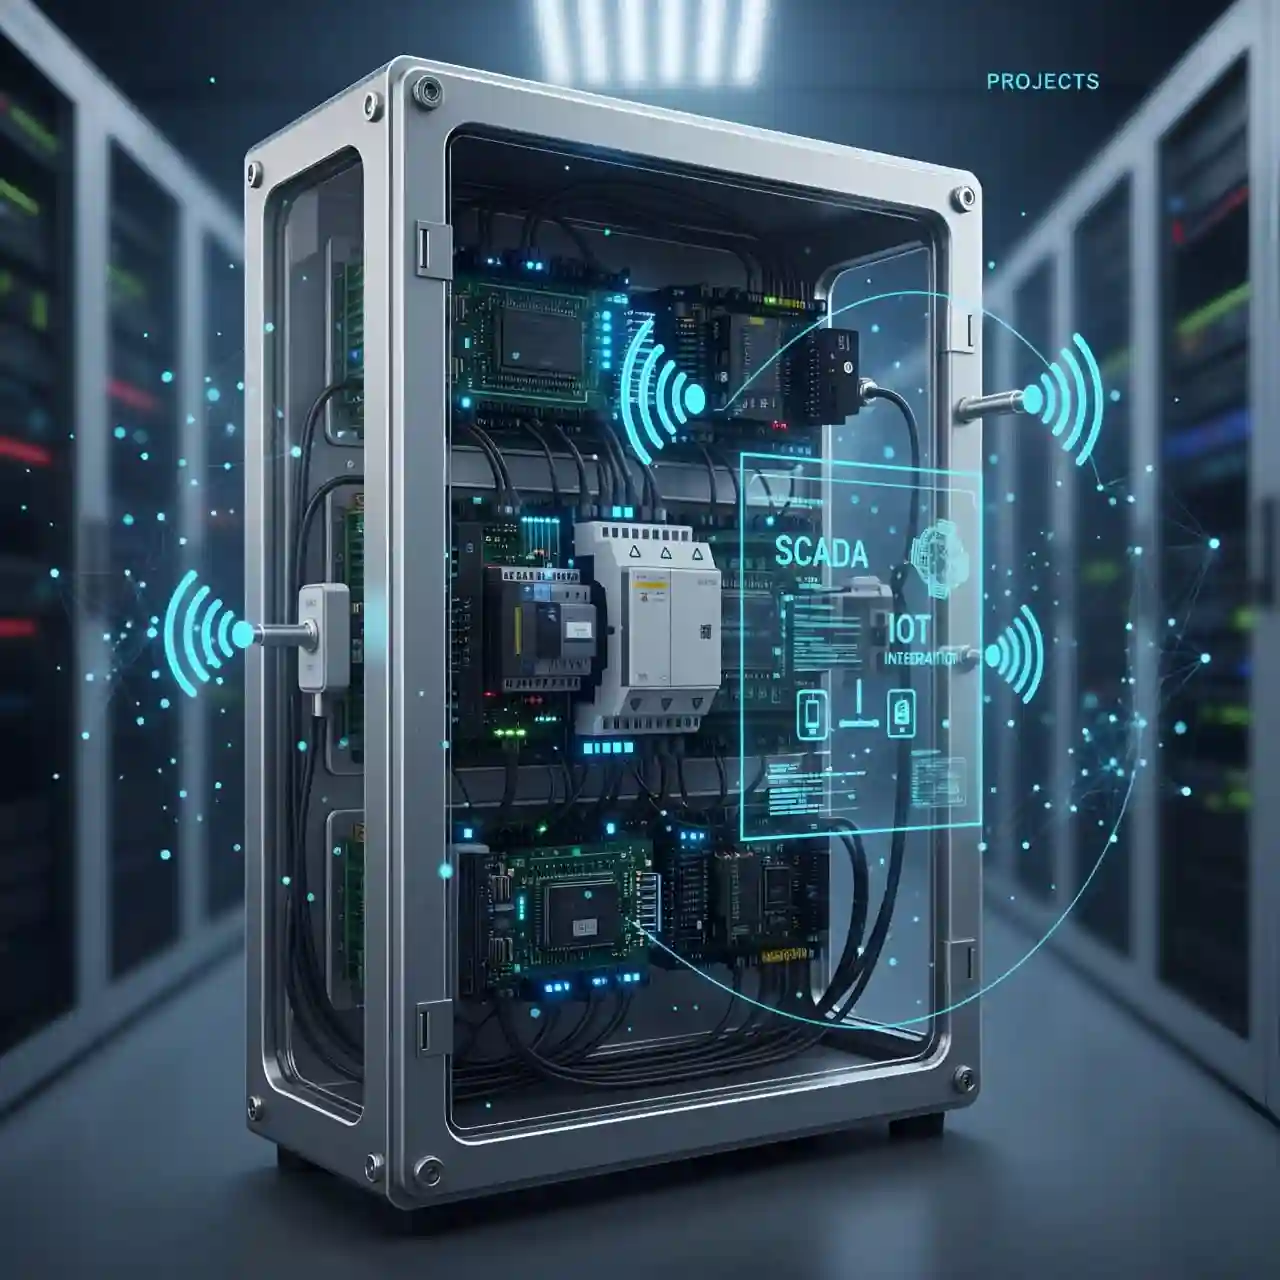
SCADA & IoT Monitoring System — Industrial Remote Control | ORTECH
Smart monitoring and control system for industrial devices and equipment — includes a real-time monitoring dashboard, smart alerts, and remote control via WiFi.
Screenshots from the System
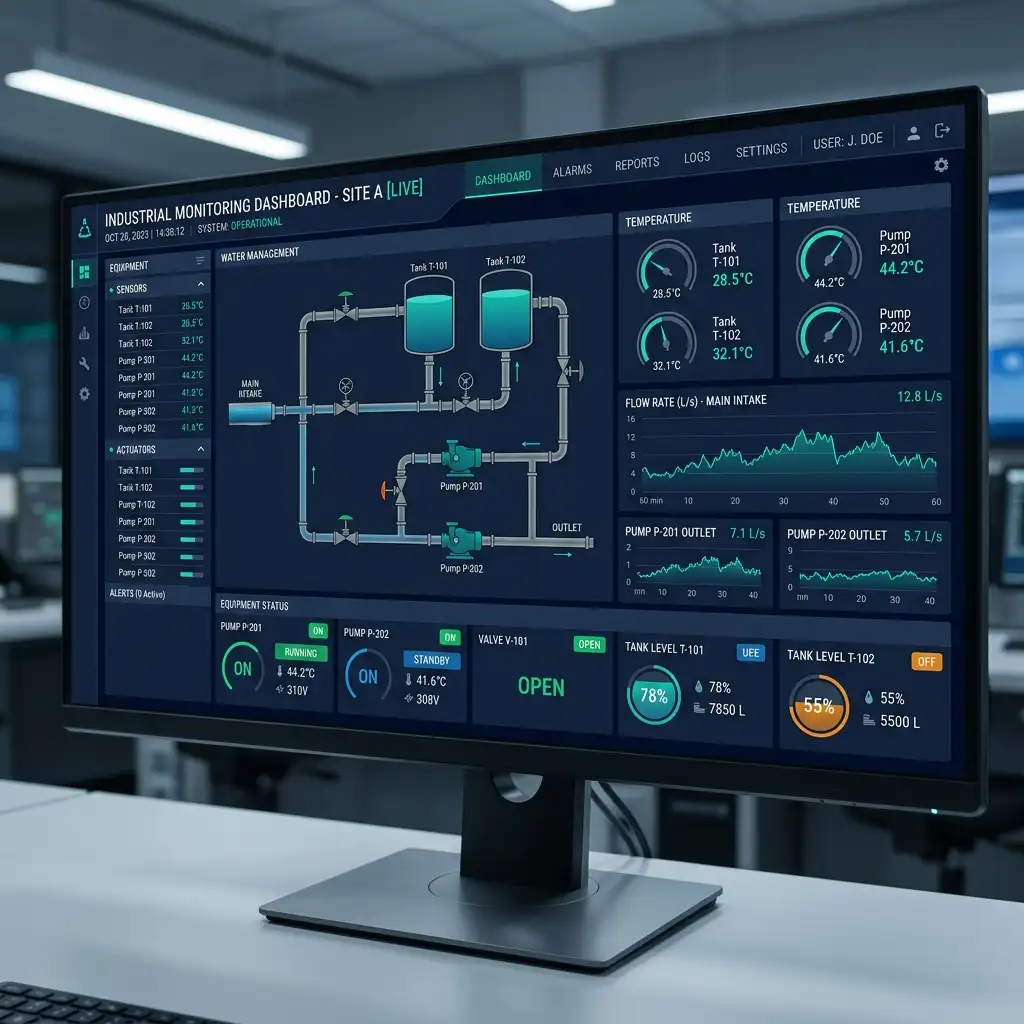
Main Dashboard — Real-time Industrial Process Monitoring
Grafana Dashboards — Performance Analytics and Charts
Alert System — Instant Notifications on Threshold Breaches
Predictive Maintenance Reports — Historical Data Analysis
Client Background
An industrial food manufacturing company in Yemen operating 3 main production lines with 50+ workers and engineers. Relied entirely on manual processes for monitoring and readings, with frequent breakdowns causing production downtime.
Problem & Context
An industrial company relied on manual equipment readings, causing: (1) significant delays in fault detection — sometimes hours or days, (2) unplanned production downtime due to undetected early failures, (3) difficulty monitoring production line performance remotely especially in remote locations, (4) complete lack of historical data analysis for process improvement, (5) dependency on manual labor for periodic readings increasing costs and human error, (6) no early warning system for hazards.
Our Solution
We built a comprehensive SCADA/IoT system collecting sensor data from ESP32 and Arduino, transmitting via WiFi/GSM to a Node.js server. Components include: (1) IoT sensors collecting data (temperature, pressure, humidity, flow, vibration) from multiple points, (2) Grafana and React dashboards displaying real-time data with charts and KPIs, (3) instant alert system via email and notifications when values exceed normal thresholds, (4) time-series data storage in InfluxDB for trend analysis and predictive maintenance, (5) intelligent analysis algorithms detecting anomaly patterns.
Key Features
Smart IoT Sensors
Sensor array (temperature, pressure, humidity, flow, vibration) transmitting data via MQTT to the server with local storage at the sensor during connection loss.
Grafana + React Dashboards
Interactive real-time dashboards with animated charts, KPI indicators, and color-coded alerts by severity level.
Instant Smart Alerts
Multi-channel alert system: email, app notifications, SMS with automatic escalation if no response within a defined period.
Predictive Maintenance
Algorithms detecting anomaly patterns before they cause failures, with predictive maintenance reports and automatic work order scheduling.
Architecture
IoT sensors (ESP32/Arduino) collect data and transmit via MQTT protocol to a Node.js server. Data is stored in InfluxDB (time-series database) and visualized through Grafana dashboards and a custom React interface. Supports multiple connectivity options: WiFi, GSM, and LoRaWAN depending on infrastructure. Architecture is designed for easy addition of hundreds of new sensors.
Security & Performance
Encrypted communications between sensors and server via TLS/SSL, multi-level role-based dashboard access, full audit trail for all readings and events, industrial network isolation from public internet via dedicated firewall, periodic security firmware updates for sensors.
Our Approach
We executed the project in 3 phases: (1) Energy and Process Audit — temporary sensor installation for 2 weeks to measure baseline and understand consumption and operation patterns, (2) Development and Installation — custom sensor design per measurement point and dashboard development in collaboration with plant engineers, (3) Continuous Improvement — after 3 months of operation, we analyzed historical data and fine-tuned alert thresholds and predictive maintenance triggers.
Project Timeline
Phase 1: Process Study & Measurement Point Identification
Phase 2: Sensor Selection & Configuration
Phase 3: ESP32/Arduino Firmware Development
Phase 4: MQTT Server & InfluxDB Development
Phase 5: Dashboard & Report Development
Phase 6: Field Installation & Testing
Phase 7: Training & Go-Live
Tech Stack
Results Delivered
“Now we see our entire factory on a single screen. Before this system, we would discover faults hours or sometimes days later. Now we know about a problem before it causes a shutdown.”
Production Engineer
Plant Manager
Why ORTECH SOLUTIONS?
We combine hardware expertise (ESP32/Arduino) with software (Node.js/Grafana) — building complete IoT solutions from sensor to control dashboard
We understand Yemen's industrial environment and its challenges: power cuts, limited connectivity, harsh conditions — our solutions are designed for these realities
We provide field technical support — our team visits the factory for maintenance and updates, not just remote support
Project FAQs
99.5%+ uptime with local data buffering at the sensor level during connection loss, ensuring no reading is ever lost.
Yes, the architecture is designed to accept hundreds of new sensors by simply adding them to the configuration file.
Supports WiFi for indoor, GSM (cellular) for remote sites, and LoRaWAN for very long-distance communication.
Yes, supports integration via standard Modbus and OPC-UA protocols for communication with existing control and monitoring systems.
The system has dedicated inputs for fire and gas sensors with immediate alarm via siren and SMS to supervisors.
Yes, Grafana provides full customization and we can also build a dedicated React dashboard per client requirements.
Industrial-grade sensors are rated for 5+ years in harsh conditions with IP65 protective enclosures.
Yes, historical data can be exported in CSV, Excel, and PDF formats with scheduled periodic reports (daily, weekly, monthly).
Understand the terms used in this project
Have a Similar Project?
We're here to help. Contact us for a free consultation